ناقش قسم الفيزياء في كلية التربية للعلوم الصرفة (ابن الهيثم) رسالة الماجستير الموسومة (دراسة تحليلية لدرجة حرارة التربة بالنسبة لملوحتها ) للطالب ( مهدي حيدر مهدي صالح ) التي انجزها تحت اشراف التدريسي في القسم ( أ.م.د. حميد مجيد عبد الجبار ).

ونوقشت الرسالة من قبل السادة اعضاء لجنة المناقشة :

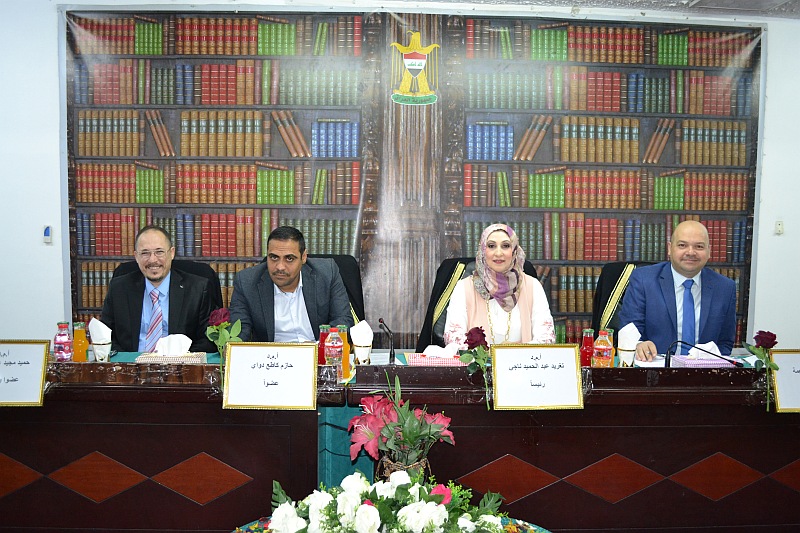
  • أ.م.د. تغريد عبد الحميد ناجي    رئيسا

  • أ.م.د. حازم كاطع دواي           عضوا

  • م.د. علي عدنان نعمة             عضوا

  • أ.م.د. حميد مجيد عبد الجبار     عضوا و مشرفا

ويهدف البحث الى :

  • الدراسة تغير الملوحة لجميع أشهر العام 2018 وعلاقة هذا التغيير مع درجة الحرارة بعد المعايرة.

  • معرفة خصائص الانعكاس الملحي للتربة المالحة في شمال مدينة بغداد. لدراسة تقلب المناخ وتغير المناخ ، على وجه الخصوص ؛ درجة الحرارة وتأثيرها على ملوحة التربة في بغداد خلال عام 2018.

  • استخدام تقنية كثافة دالة الاحتمالية لربط ملوحة التربة بقيمتها الحرارية كما هو مقترح في هذا العمل البحثي ، وتمنحنا القدرة على مقارنة ملوحة التربة بطريقة تفاضلية اعتمادًا على تباين درجات الحرارة ، وهو ما يمثل طريقة مثيرة للاهتمام لتقييم التربة بسرعة ملوحة منطقة الاهتمام.

وتم في هذه الدراسة عرض العلاقة بين درجة حرارة سطح التربة العارية مقارنتا بملوحتها. غطت الدراسة جميع أشهر سنة 2018 لمنطقة الدراسة المختارة، التي تقع شمال مدينة بغداد بعد فصل التربة العارية فقط من الطبقات الأخرى في المنطقة (المناطق الحضرية والنباتية).

تم استخدام المصنف Support Vector Machen SVM بعد تحويل القيم الرقمية للمرئيات إلى انعكاسية طيفية. بشكل عام، نجح مصنف SVM في تصنيف مكونات الغطاء الأرضي بدقة تتراوح من 88 إلى 98٪.

تم حساب الملوحة الطيفية باستخدام الحزم الطيفية NIR وRED لأن استجابة الملح جيدة في هذه الحزم الموجية كما أكدت معظم الدراسات. تمت معايرة قيم الملوحة المحسوبة طيفيًا بناءً على قيم الملوحة المحسوبة عمليًا عن طريق أخذ عينات من تربة موقع الدراسة في تاريخ مطابق ليوم أخذ العينات 5/3/2019 ومقارنتها بالملوحة المحسوبة طيفيًا لذلك التاريخ.

تم احتساب ملوحة التربة بشكل عملي عن طريق تجفيف عينات التربة وغربلتها بمنخل ذو قياس 1 ملم وقياس الملوحة بوحدات dS / m بعد أخذ ثلاث نسب مئوية من خلط مياه التربة: 1-1، 1-2 و1 -5.

يتم حساب درجة حرارة الغلاف الجوي العلوي (TOA) في منطقة الدراسة بواسطة درجة مئوية، مع مراعاة ارتفاع درجة الحرارة فقط من أدنى درجة حرارة بعد شروق الشمس وحتى اللحظة التي يلتقط فيها القمر الصناعي صورة المشهد.

لتوضيح قيم الملوحة المعايرة ودرجات حرارة السطح المسجلة التي ترتفع بعد شروق الشمس لكل مشهد من أشهر عام 2018، يتم استخدام تقنية تقطيع الألوان لتقسيم نطاق الملوحة ودرجة الحرارة إلى 30 نطاق جزئي، مما يمثل كل نطاق جزئي في نطاق مميز اللون، بدءا من الأحمر إلى الأزرق في ترتيب تصاعدي.

لدراسة العلاقة المتبادلة بين قيم الملوحة المعايرة وارتفاع درجة حرارة السطح بعد شروق الشمس، يتم استخدام تقنية كثافة الاحتمال ثنائية الأبعاد 2D PDF. ويعود السبب في استخدام تقنية 2D كون الأملاح التي تشكل خليط التربة الذي يحتوي على قيم ملوحة معتدلة مع احتمالية كبيرة للظهور وغيرها من الاملاح التي تحتوي على قيم أعلى من الملوحة مع احتمال أقل للظهور، حيث تختلف قيمتها واحتماليتها للظهور تبعًا للموسم ولأنه يعتمد على درجة حرارة ورطوبة التربة. هذه التقنية من خلال ربط ملوحة التربة بدرجة حرارة السطح تمنحنا القدرة على المقارنة التفاضلية بين أنواع التربة المختلفة التي تشكل سطح الأرض من حيث ملوحتها، وهذا يتوقف على الفرق في درجة حرارة السطح.

التوصيات :

  1. تحليل تركيبة التربة وإدراجها في صيغة لحساب قيمة الملوحة الطيفية على أساس الطيفية الرنانة من تكويناتها.

  2. تطبيق الدراسة على منطقة قاحلة نائية لا تحتوي على خصائص أخرى غير طبقة التربة.

  3. استخدام مؤشر رطوبة التربة وتأثيره على قيمة الملوحة بجانب ارتفاع درجة الحرارة.


Analytical Study of Earth Cover Temperature with Respect to its Salinity

By Mahdi Haidar Mahdi

Supervised by Asst.prof.Dr.Hameed Majeed Abduljabar

The Aim of Thesis

Study the salinity change for all months of the year 2018 and the relationship of this change with temperature after calibration

know the characteristics of the saline reflectivity of saline soils in the north of Baghdad city

To study climate variability and climate change, in particular; temperature, and its impact on soil salinity in Baghdad during the year 2018

Present a new approach to relate the soil salinity with its temperature value as suggested in this research work, give us the ability to compare the soil salinity by a differential manner depending on their temperature variation, which represents an interesting approach to quickly evaluate the soil salinity of a region of interest

Abstract

                In this study, the relationship between bare soil surface temperature with respect to its salinity. The study covered all the months of 2018 for the study area, which is located north of Baghdad city after the bare soil class was separated only from the other classes in the area Urban and Plant

            The Support Vector Machen SVM classifier was used after converting the numeric values of the visuals into spectral reflectivity. In general, the SVM classifier has been successful in classifying ground cover components with a rate of accuracy 88-98%

                Salinity is calculated spectrally by using NIR and RED spectral bands because the salt response is good in these wavebands as confirmed by most studies. Calibration of spectrally calculated salinity values is done based on practically calculated salinity values by taking samples from the soil of the study site on a date corresponding to the sampling day 5/3/2019 and comparing them with spectrally calculated salinity for that date.

                The salinity of the soil was practically calculated by drying the soil samples and sifting them with a sieve of 1 mm and measuring the salinity in dS/m units after taking three percentages of soil-water mixing: 1-1, 1-2 and 1-5

The top of atmosphere (TOA) temperature of the study area is calculated by the Celsius degree, taking into account the rise in temperature only from the minimum temperature after sunrise to the moment the satellite captures the scene image

                In order to illustrate the calibrated salinity values and recorded surface temperatures raising after sunrise for each scene of the months of the year 2018, color slicing technique is used to divide the salinity range and temperature into 30 partial range, representing each partial range in a distinctive color, starting from red to blue in ascending order

                To study the interrelationship between calibrated salinity values and surface temperature rise after sunrise, a two-dimensional probability density technique 2D PDF is used. They are due to the salts that make up the soil mixture which has moderate salinity values with high probability to appear and other salts that have higher salinity values with a lower probability to appear, where their value and probability varies depending on the season and because it depends on the temperature and moisture of the soil. This technique by linking the soil salinity to the surface temperature gives us the ability to deferentially compare the different soil types that make up the surface of the earth in terms of its salinity, depending on the difference in surface temperature

Future Works

Analysis of soil compositions and its inclusion in the formula for calculating the salinity value spectrally based on the resonant spectral range of its compositions

Applying the study to a remote arid area that has no features other than soil class.

using soil moisture index and its effect on salinity value beside the temperature rising.

IhcoeduAuthor posts

Avatar for ihcoedu

كلية التربية للعلوم الصرفة (ابن الهيثم) College of Education for Pure Science (Ibn Al-Haitham)

Comments are disabled.