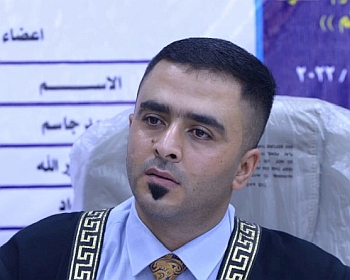
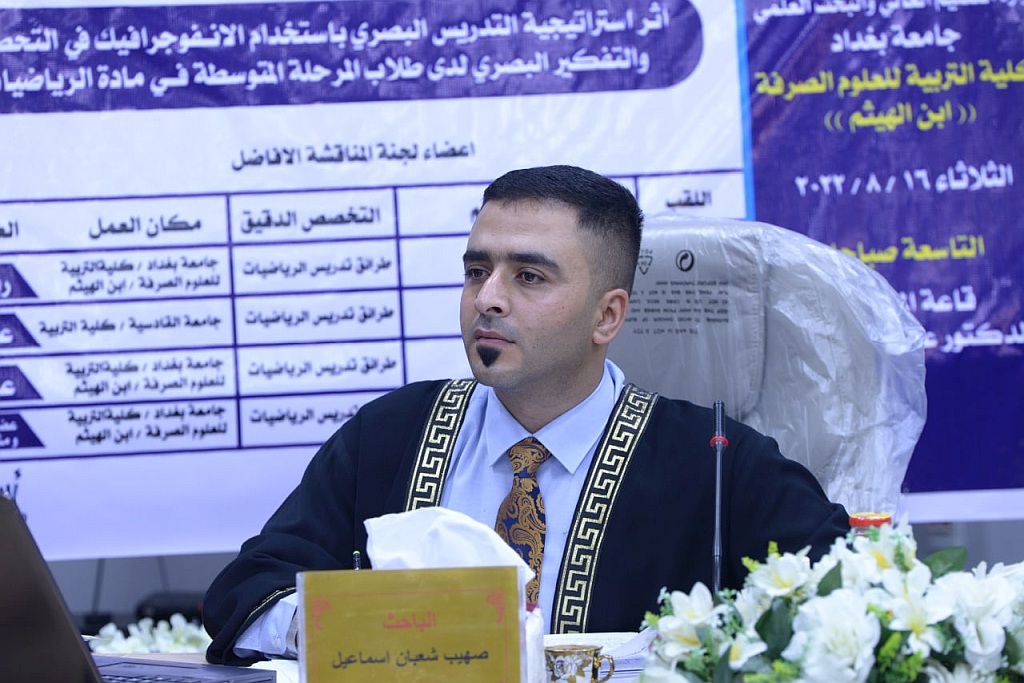
ناقش قسم الرياضيات في كلية التربية للعلوم الصرفة (ابن الهيثم) رسالة الماجستير الموسومة ” أثر استراتيجية التدريس البصري باستخدام الانـفوجرافيك في التحصيل والتفكير البصري لدى طلاب المرحلة المتوسطة فـي مادة الرياضيات ”  للطالب ” صهيب شعبان اسماعيل ” التي انجزها باشراف التدريسية في قسم علوم الحاسبات ” أ.م.د. لينا فؤاد جواد ” ونوقشت من قبل لجنة المناقشة المبين أسماء أعضائها في ما يأتي :

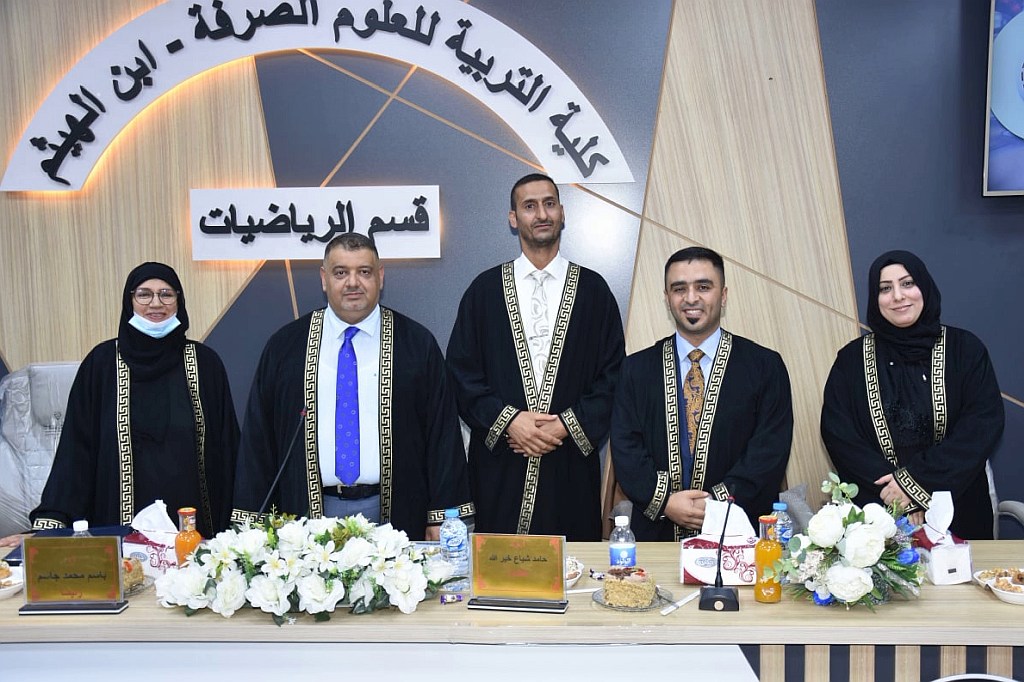
  • أ.د. باسم محمد جاسم – رئيساً

  • أ.م.د. حامد شياع خير الله – عضواً

  • م.د. هيام مهدي جواد – عضواً

  • أ.م.د.  لينا فؤاد جواد – عضواً ومشرفاً

ويهدف هذا البحث الى معرفة اثر استراتيجية التدريس البصري باستخدام الانفوجرافيك في كل من :

  1. التحصيل لدى طلاب المرحلة المتوسطة في مادة الرياضيات.

  2. التفكير البصري لدى طلاب المرحلة المتوسطة في مادة الرياضيات.

يهدف البحث الحالي الى معرفة اثر استراتيجية التدريس البصري باستخدام الانفوجرافيك في التحصيل والتفكير البصري لدى طلاب المرحلة المتوسطة في مادة الرياضيات.

ولتحقيق هدف البحث وضع الباحث الفرضيتين الصفريتين الاتيتين:

  1. ((لا يوجـــد فروق ذو دلالــة احصــائية عند مستـــوى (05) بين متوسطي درجات طلاب المجموعة التجريبية الذين درسوا على وفق استراتيجية التدريس البصري باستخدام الإنفوجرافيك ودرجات الطلاب الذين درسوا وفق الطريقة الاعتيادية في اختبار التحصيل)).

  2. ((لا يوجـــد فروق ذو دلالــة احصــائية عند مستـــوى (05) بين متوسطي درجات طلاب المجموعة التجريبية الذين درسوا على وفق استراتيجية التدريس البصري باستخدام الإنفوجرافيك ودرجات الطلاب الذين درسوا وفق الطريقة الاعتيادية في اختبار التفكير البصري)).

اعتمد الباحث منهج البحث التجريبي, إذ تم استعمال التصميم التجريبي ذي الاختبار البعدي لكل من التحصيل والتفكير البصري لمجموعتين مستقلتين ومتساويتين, اذ تم تطبيق التجربة على عينة تتألف من (52) طالباً من طلاب الصف الاول المتوسط في متوسطة (الحق المبين للبنين) التابعة للمديرية العامة في محافظة الانبار- قسم تربية الفلوجة للعام الدراسي (2021-2022) اختيرت قصدياً لتطبيق التجربة, وتم توزيع عينة البحث بالتساوي على مجموعتي البحث واختيرت شعبة (ب) عشوائياً لتكون المجموعة التجريبية أما شعبة (أ) فكانت هي المجموعة الضابطة ,اذ تم التوزيع وفقاً لبيانات المتغيرات الاتية : العمر الزمني , والتحصيل السابق, واختبار المعرفة السابقة, واختبار الذكاء لغرض التكافؤ.

اعد الباحث متطلبات التجربة التي تتمثل بــ ( تحديد المادة العلمية , وتحليل المحتوى للمادة العلمية , وصياغة الاغراض السلوكية , وأعداد كل من الخطط وتصميمات الانفوجرافيك), وتم بناء أداتين للبحث هما : اختبار التحصيل الذي تكون من (30) فقرة موضوعية من نوع الاختيار من متعدد ذو اربعة بدائل, واختبار التفكير البصري وتكون بصورته النهائية من (23) فقرة موضوعية من نوع الاختيار من متعدد ذو اربعة بدائل, حيث تم التحقق من صدق الاختبارين, واحتساب ثباتهما ووجد مقبولاً, وكذلك وجدت معاملات الصعوبة والسهولة والتمييز وفاعلية البدائل الخاطئة, لجميع فقرات الاختبارين .

وبعد اتمام التجربة طبق الباحث اداتي البحث وباستعمال الحقيبة الاحصائية (SPSS-26), واعتماد اختبار ليفين والاختبار التائي (t-test) لعينتين مستقلتين.

أظهرت النتائج تفوق طلاب المجموعة التجريبية الذين درسوا وفق استراتيجية التدريس البصري باستخدام الانفوجرافيك على طلاب المجموعة الضابطة الذين درسوا وفق الطريقة التقليدية في اختباري التحصيل والتفكير البصري

وخلص الطالب في ختام رسالته الى التوصيات الاتية :

  1. تشجيع وحث الـمدرسين والـمدرسـات على أَن يستعملوا استراتيجية التدريس البصري باستخدام الانفوجرافيك عند تدريس مادة الرياضيات للطلاب الاول المتوسطة, لما لها من اثر كبير في تحصيل الطلاب وتفكيرهم البصري.

  2. دعوة الجهات المختصة (الاعداد والتدريب) في وزارة التربية ومديرياتها بتنظيم دورات تدريبية على تطبيق استراتيجية التدريس البصري و استخدام وتصميم الانفوجرافيك وكيفية توظيفهما في تدريس مادة الرياضيات.

  3. دعوة الجهات المعنية في وزارة التربية ومديرياتها بتهيئة بيئة صفية ملائمة للتدريس البصري وتجهيزها بكافة المستلزمات من اجهزة عرض وسبورات ذكية وإعداد مناهج تحتوي بعد كل موضوع رابط الكتروني يمكن الطالب من الولوج الى انفوجرافيك يوضح الدرس وهذا من شأنه ان ينتقل بالطالب ليكون فعال داخل غرفة الصف.

دعوة لكليات التربية في الجامعات الى تضمين استراتيجيات ونماذج تدريسية حديثة, منها استراتيجية التدريس البصري في برامج إعداد طلبتها قبل التخرج والعمل على تطوير مهاراتهم في تصميم الانفوجرافيك, مما ييسر لهم تطبيقها عند شروعهم بمزاولة مهنة التدريس.


The effect of the visual teaching strategy using infographics on achievement and visual thinking for intermediate stage male students in mathematics

By Suhaib Shaaban Ismail

Asst. Prof. Dr. Lina Fouad Jawad

The aim of work

The current research aims to know the effect of the visual teaching strategy using infographics on each of

The achievement of middle school students in mathematics

Visual thinking among middle school students in mathematics

Abstract

The current research aims to find out the effect of the visual teaching strategy using infographics on the achievement and visual thinking in mathematics for intermediate grade male students

To achieve the aim of the research, the researcher put the following two null hypotheses

There are no statistically significant difference at the level (0.05) between the average scores of the experimental group students who will study according to visual teaching strategies using infographics and the control group students who will study according to the usual method in the achievement test

The researcher adopted the experimental research method, the experimental design was used for two independent and equal groups with a post-test for both achievement and visual thinking

     The experiment was applied to a sample consisting of (52) male students from the first intermediate grade in the (Al-Haq Al Mubin for Boys) intermediate school  affiliated to the General Directorate in Anbar Governorate – Fallujah Education Department for the academic year (2021-2022) who were intentionally chosen to implement the experiment.

    The research sample was distributed equally to the two research groups, Division (B) was chosen randomly to be the experimental group, while Division (A) was the control group, as the distribution was according to the data of the following variables: chronological age, previous achievement, prior knowledge test, and intelligence test .

      The researcher prepared the requirements of the experiment, which are (identifying the scientific subject, analyzing the content of the scientific subject, formulating behavioral objectives, and preparing each of the plans and infographic designs).

      The researcher built two tools for research which: the achievement test, which consisted of (30) objective items of a multiple choice type with four alternatives ,the visual thinking test, in its final form, consists of (23) objective items of a multiple-choice type with four alternatives.

     The validity of the two tests was verified, and their stability was calculated and found acceptable, as well as the coefficients of difficulty and ease and discrimination and the effectiveness of the wrong alternatives, for all items of the two tests.

            After completing the experiment, the researcher applied the two research tools using the statistical package (SPSS-26), and the adoption of the Levin test and the t-test for two independent samples.

     The results showed that the superiority of students of the experimental group who studied according to the visual teaching strategy using infographics compared to the students of the control group who studied according to the traditional method in the achievement and visual thinking tests.

The recommendations

Encouraging and urging male and female teachers to use the visual teaching strategy using infographics when teaching mathematics to first intermediate students, because of its great impact on students’ achievement and visual thinking

Inviting the competent authorities (preparation and training) in the Ministry of Education and its directorates to organize training courses on the application of the visual teaching strategy and the use and design of infographics and how to employ them in teaching mathematics.

Inviting the concerned authorities in the Ministry of Education and its directorates to create an appropriate classroom environment for visual teaching, equipping it with all requirements such as projectors and smart boards, and preparing curricula that contain after each topic an electronic link that enables the student to access an infographic explaining the lesson, and this will move the student to be effective in the classroom

. An invitation to faculties of education in universities to include modern teaching strategies and models, including the visual teaching strategy, in the programs of preparing their students before graduation and to work on developing their skills in infographic design, which facilitates their application when they start practicing the teaching profession

IhcoeduAuthor posts

Avatar for ihcoedu

كلية التربية للعلوم الصرفة (ابن الهيثم) College of Education for Pure Science (Ibn Al-Haitham)

Comments are disabled.